File statistics
The following tables present basic statistics on the collected robots.txt files and their development over the years. The statistics are furthermore aggregated for 16 website categories. For categorizing the websites, we employed the Curlie top level label (Example: https://cnn.com /robots.txt -> News). Note that the human-curated, filtered Curlie directory contains links to less than one million of hosts and consequently most robots.txt files remain unlabeled.
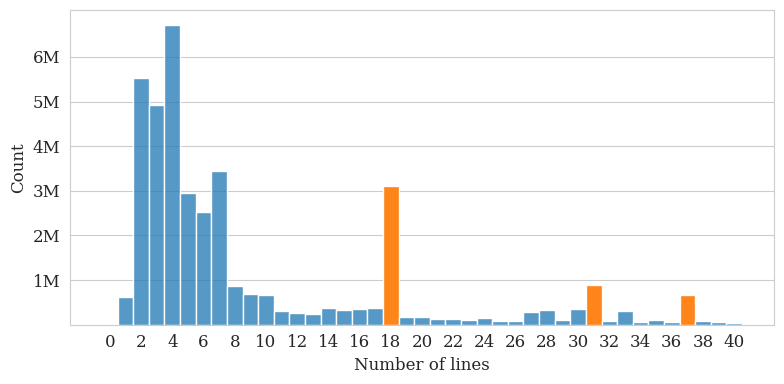
We furthermore looked at the distribution of files sizes and the number of lines in the robots.txt files, yielding an interesting insight. The usage of some file templates of Content Management Systems, such as wix.com or WordPress , are so popular that they lead to significant peaks in the length distribution.
Content length (file size) ▼ Show website categories
2016
2017
2018
2019
2020
2021
2022
2023
Overall
513
503
622
460
426
442
459
464
Arts
478
476
538
491
481
501
508
531
Business
549
583
588
592
587
576
585
571
Computers
599
631
618
654
648
646
663
703
Games
600
634
747
573
598
540
881
829
Health
569
613
608
575
537
515
514
525
Home
620
637
645
647
677
649
617
624
Kids & Teens
552
551
552
542
481
432
439
467
News
949
1292
1748
820
804
818
883
1115
Recreation
569
555
554
531
509
537
546
559
Reference
1095
1099
1310
1356
1458
1526
1490
1483
Regional
491
436
577
542
517
550
517
503
Science
629
651
657
666
661
683
681
670
Shopping
816
846
870
949
1018
1037
1097
1161
Society
575
562
632
599
593
613
599
597
Sports
454
458
508
498
478
501
615
588
Number of lines ▼ Show website categories
2016
2017
2018
2019
2020
2021
2022
2023
Overall
19.8
19.4
23.6
18.2
16.0
17.0
17.9
17.8
Arts
17.9
18.0
20.7
18.5
18.0
19.1
19.6
20.4
Business
19.7
20.8
21.1
20.9
20.7
20.4
21.0
20.5
Computers
21.9
22.7
22.6
23.7
23.8
23.5
24.1
25.0
Games
22.6
24.2
27.3
21.8
23.2
21.6
34.5
32.2
Health
20.8
21.6
21.9
20.7
19.3
18.7
18.7
18.8
Home
23.1
23.7
23.9
24.0
25.2
24.2
23.4
23.6
Kids & Teens
20.2
19.6
20.1
19.5
18.9
16.7
16.8
18.0
News
35.1
44.4
57.9
27.5
27.8
28.5
29.5
33.8
Recreation
20.7
20.6
20.9
19.7
19.2
20.4
21.0
20.8
Reference
39.1
39.3
47.6
49.8
51.3
55.3
55.7
55.2
Regional
17.8
17.1
21.3
19.9
19.0
20.4
19.1
18.5
Science
23.5
24.4
24.8
25.3
25.0
25.3
25.2
25.3
Shopping
29.5
30.8
32.2
34.9
37.2
38.7
40.7
43.1
Society
21.1
20.5
23.3
21.3
20.9
22.1
21.9
21.9
Sports
17.0
17.3
19.1
19.4
18.3
19.5
21.9
21.2
Number of user agents ▼ Show website categories
2016
2017
2018
2019
2020
2021
2022
2023
Overall
6.5
7.0
6.9
3.9
3.0
3.1
3.4
3.5
Arts
3.4
3.5
3.6
3.0
3.4
3.4
3.8
4.2
Business
2.5
2.5
2.6
2.6
2.8
2.8
3.0
3.2
Computers
3.2
3.4
3.5
3.7
3.8
3.9
4.0
4.0
Games
7.3
8.6
8.2
4.0
5.2
4.9
4.9
5.5
Health
3.0
3.1
2.9
2.8
2.7
2.8
3.0
3.1
Home
4.5
4.7
4.5
4.5
5.1
4.7
4.9
4.7
Kids & Teens
4.2
3.9
4.1
3.9
3.6
3.2
3.4
3.8
News
4.3
4.8
4.7
3.5
3.5
3.8
3.9
5.0
Recreation
4.3
4.5
4.3
3.6
3.5
3.9
4.3
4.2
Reference
4.5
5.4
6.7
7.8
7.9
9.6
10.8
10.7
Regional
2.3
2.7
4.0
3.5
3.5
4.0
3.8
3.4
Science
2.8
3.1
3.1
3.4
3.5
3.8
3.7
4.3
Shopping
3.6
3.8
3.9
4.2
4.4
4.8
5.0
5.3
Society
2.9
3.0
3.3
3.1
3.5
4.2
4.3
4.4
Sports
2.9
3.1
3.2
3.4
3.5
4.2
4.4
4.4